Results
In 2018, the Radford Phenology Monitoring Project was interested in comparing 2018 winter to spring plant phenology to patterns from previous years. We also were interested in exploring seasonal differences between native plant species such as box elder (Acer negundo) and Northern spicebush (Lindera benzoin) and invasive species such as Amur honeysuckle (Lonicera maackii) and multiflora rose (Rosa multiflora).
Our monitoring focused on leaf and flower development because these are critical to plant growth, timing of plant pollination, and successful reproduction. Breaking leaf buds also are important indicators of the Start of Spring.
Our monitoring focused on leaf and flower development because these are critical to plant growth, timing of plant pollination, and successful reproduction. Breaking leaf buds also are important indicators of the Start of Spring.
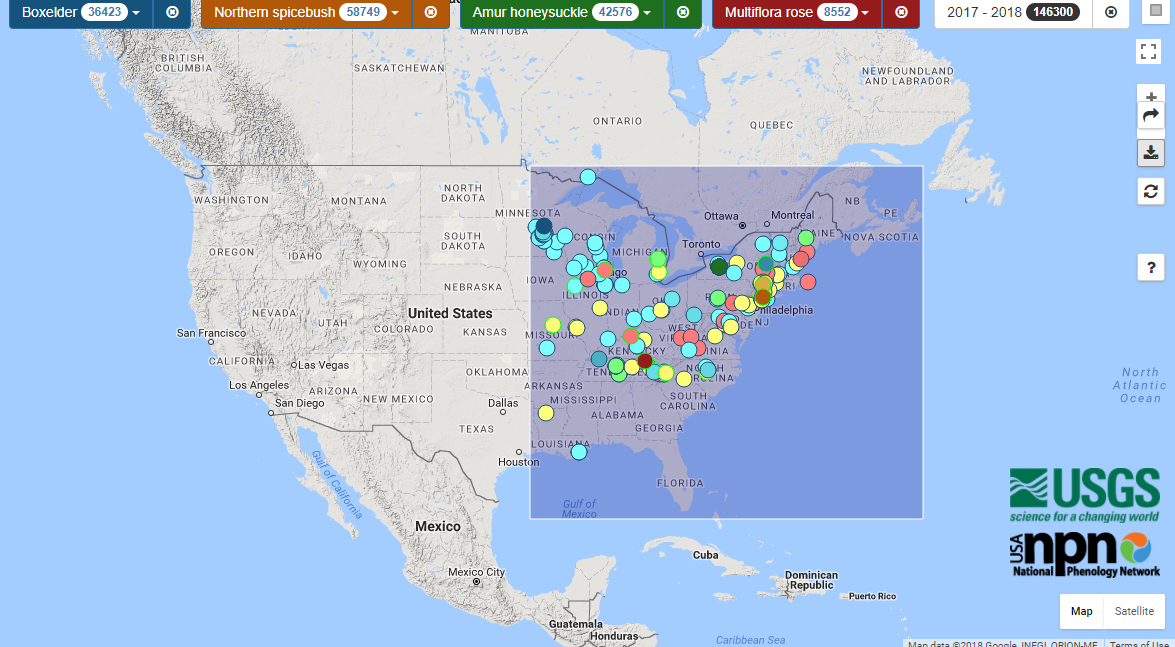
Figure 1: Radford Phenology Monitoring data was compared to phenology data collected at other National Phenology Network (NPN) monitoring locations in 2017 and 2018 throughout the eastern United States.
Visualization Calendars: Timing of Leaves & Flowers
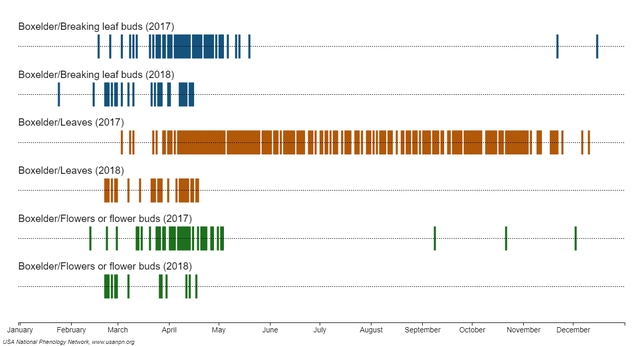
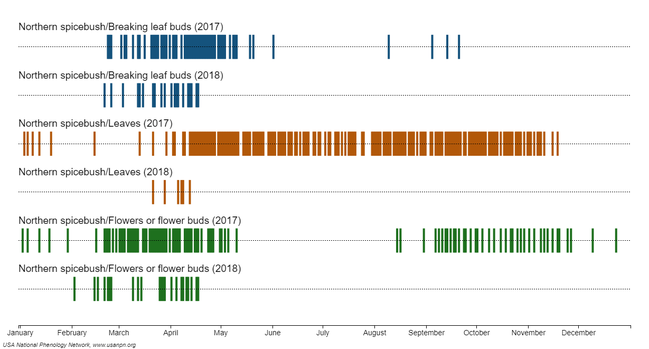
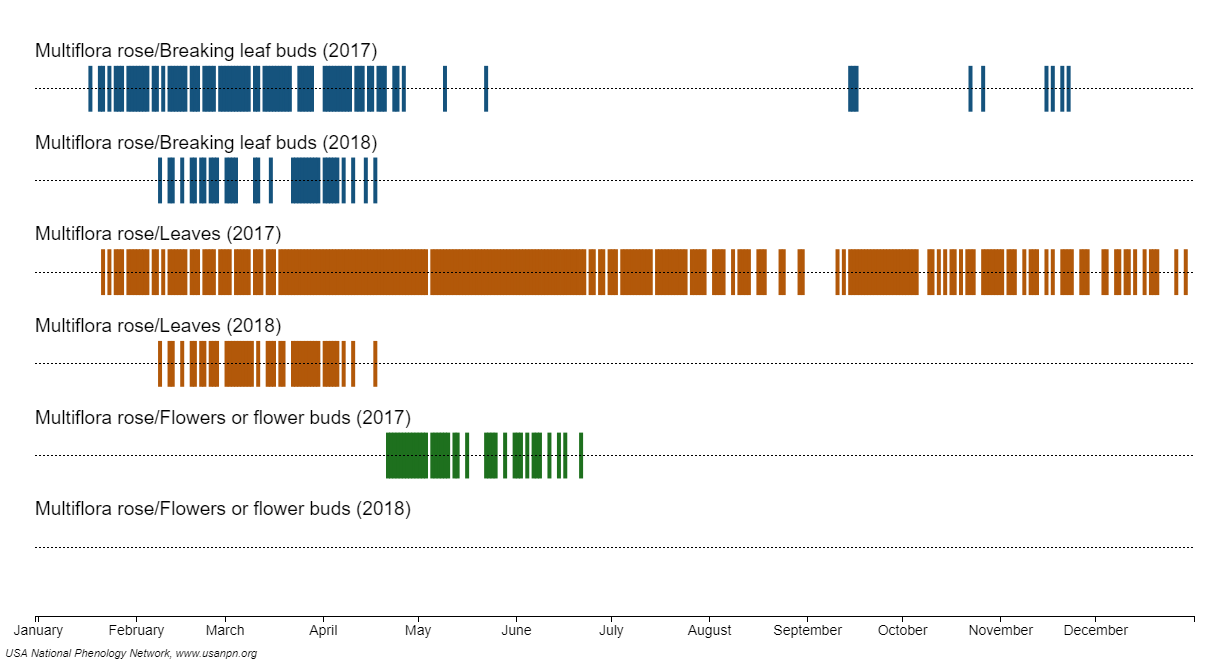
The Radford Phenology Monitoring project compared emergence of spring leaves and flowers in native and invasive shrubs using the National Phenology Network's "Visualization Calendar" tool. This allowed us to compare the timing of phenophases (e.g., breaking leaf buds, leaves, flower buds, open flowers) across different species and activity periods.
|
Box elder (Acer negundo) leaf & flower phenology (a native tree species) |
|
|
Spicebush (Lindera benzoin) leaf & flower phenology (a native shrub) |
|
|
Multiflora rose (Rosa multiflora) leaf & flower phenology (an invasive shrub) |
|
|
Amur honeysuckle (Lonicera morrowii) leaf & flower phenology (an invasive shrub) |
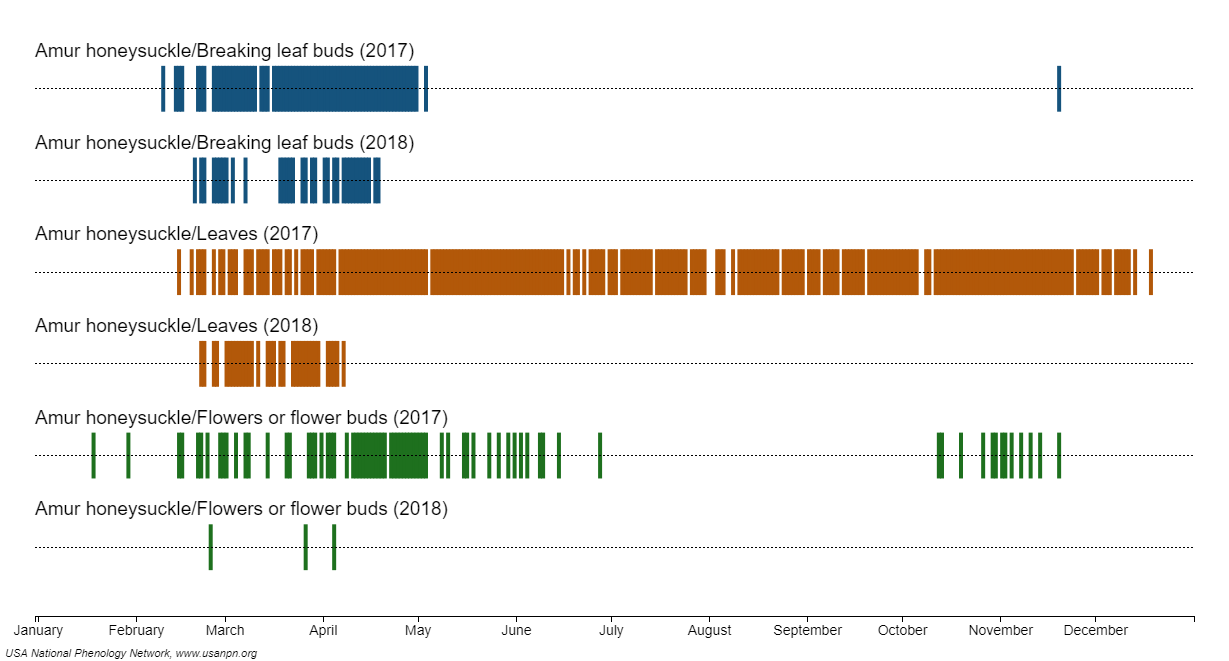
|
Notice that box elder and spicebush, species native in Virginia's natural ecosystems, typically develop leaves and flowers later in the spring and drop their leaves earlier in the fall than non-native invasive species like multiflora rose and Amur honeysuckle. This longer growing season ("extended leaf phenology") gives invasive shrubs a huge advantage! Multiflora rose shows especially early breaking leaf buds and earlier leaf development than our native species.
Activity Curve Summary
We also compared native and invasive plants by using activity curves or timelines of last year (2017) and this year (2018) when discussing breaking leaf buds, leaves and flower buds. Even though 2018 is still in progress, we studied and compared data from January 15th to April 15th of this year (2018). Activity curves are a good way to show the positive and negative changes happening every week within a given month for individual plant species.
Our data shows native plants, such as Box Elder and Northern Spice Bush, have a lower count of breaking leaf buds, leaves and flower buds in April of 2018 compare to April of 2017, Figure 1 & 2. Invasive plants, such as Amur Honeysuckle and Multiflora Rose, are declining in breaking leaf buds, leaves and flower buds in April of 2018 compare to April of 2017, which the invasive plants were increasing around this time last year (2017), Figure 3 & 4. As for this year (2018), native plants are doing far better for breaking leaf buds, leaves and flower buds than invasive plants.
For Box Elders, it had a faster growing season from January to February this year (2018) when it comes to breaking leaf buds, leaves and flower buds, but it slows down, which means last year (2017) had a faster growing season in April, Figure 1. For Northern Spice Bush, it had a faster growing season from January to February this year (2018) when it comes to breaking leaf buds only and then it slows down, which means last year (2017) had a faster growing season in April. For leaves and flower buds, it has a slow start this year (2018). Last year (2017), it still had way more leaves and flower buds growing on the plant in April, Figure 2. For Amur Honeysuckle, it had a slower growing season from January to February this year (2018) when it comes to breaking leaf buds, leaves and flower buds. During April of 2018, it simply has no breaking leaf buds, leaves and flower buds compare to last year (2017), Figure 3. For Multiflora Rose, is also had a slower growing season from January to February this year (2018) when it comes to breaking leaf buds, leaves and flower buds. During April of 2018, there is no breaking leaf buds or flower buds on the plant species and leaves went up between January to March of this year (2018), but rapidly decline in April of 2018 compare to last year (2017) when it was still increasing, Figure 4.
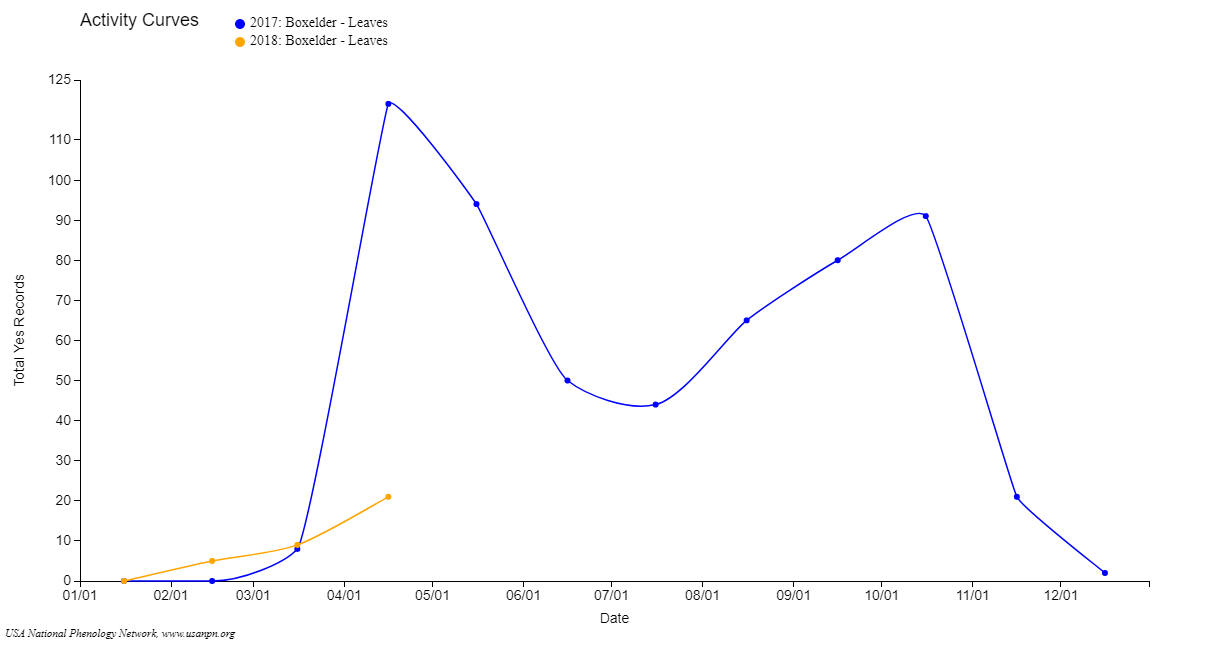
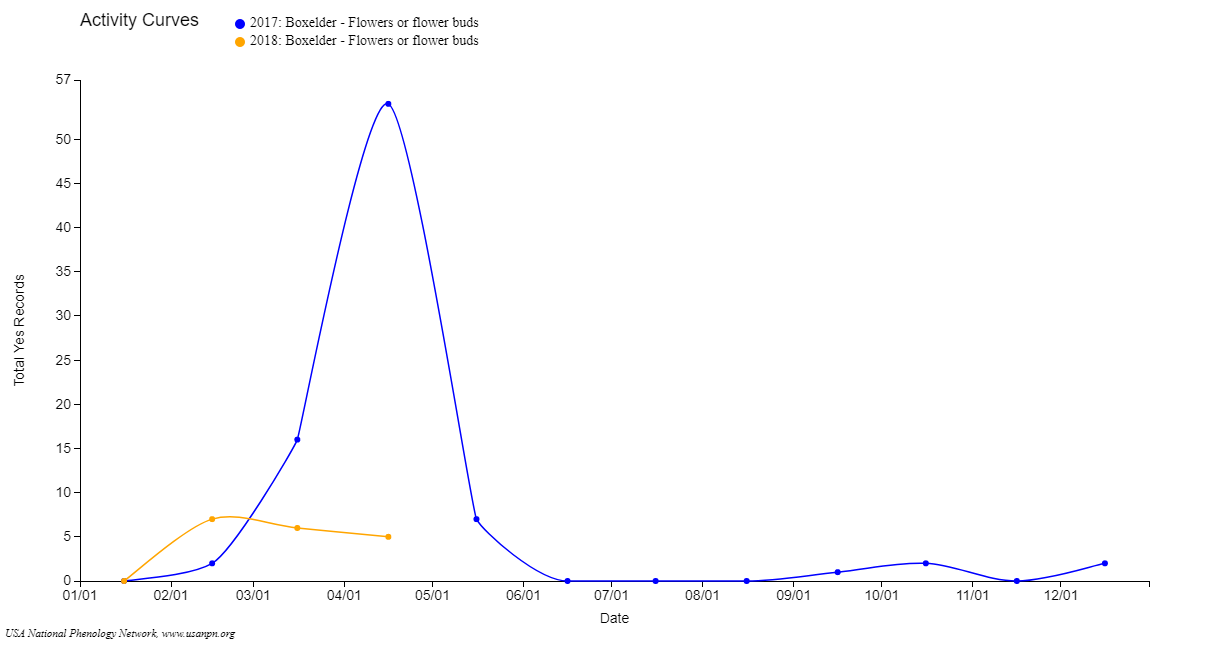
Figure 1: Box Elder activity curves for breaking leaf buds, leaves and flower buds (By NPN)
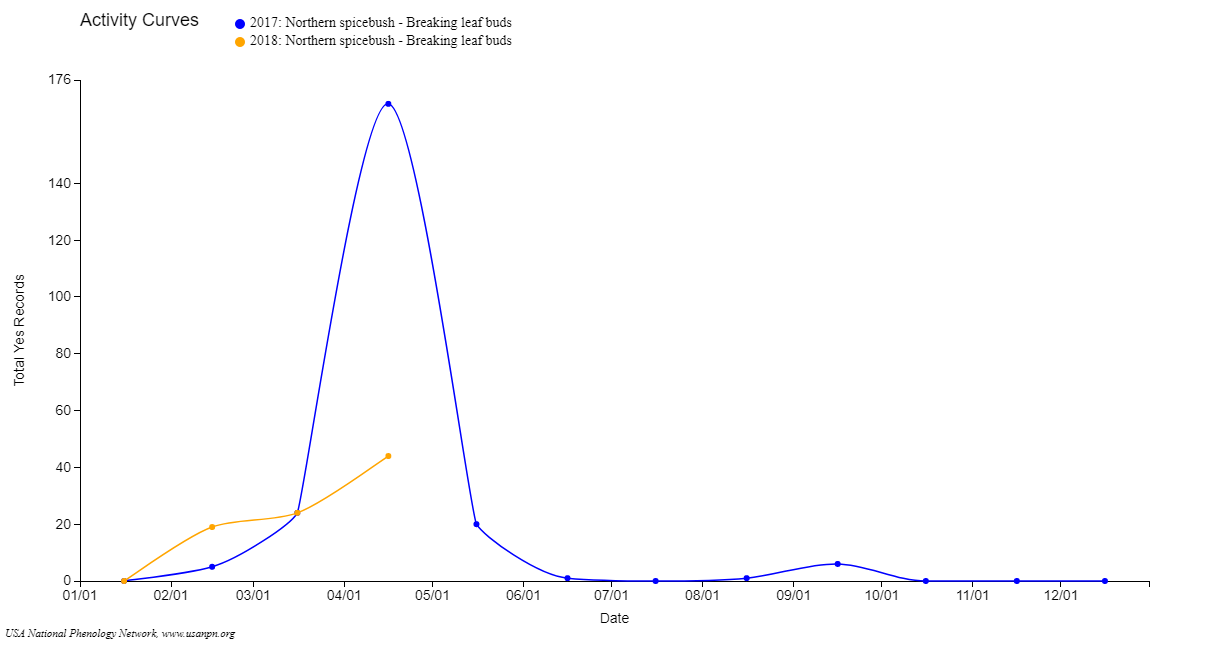
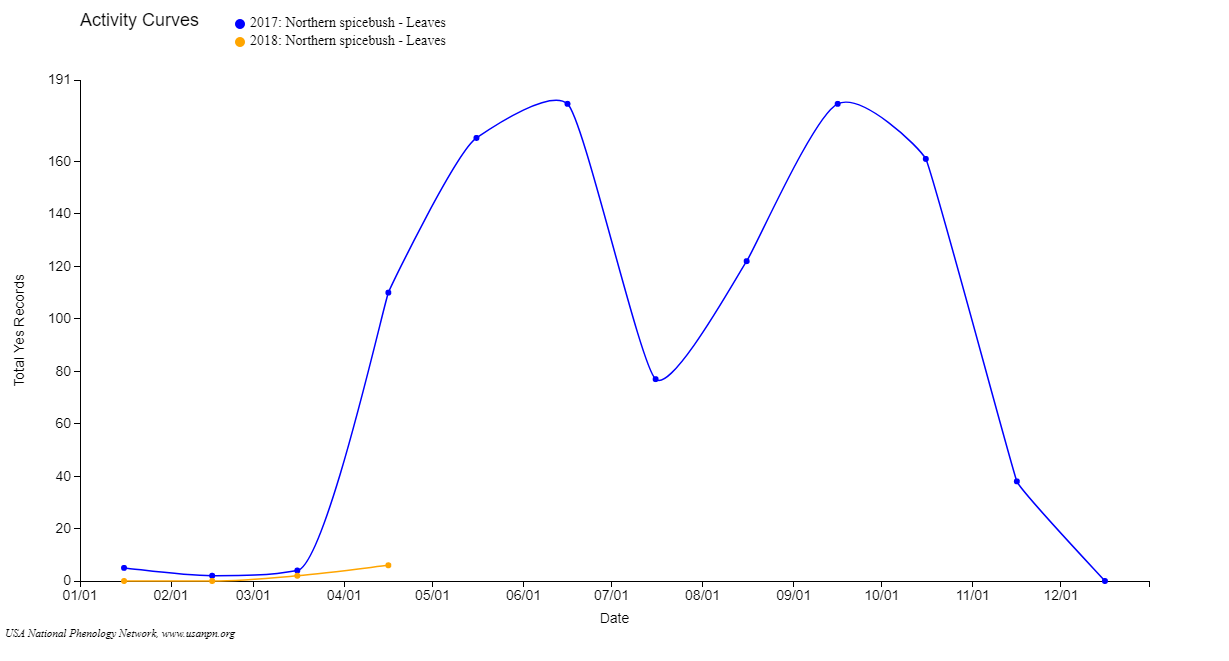
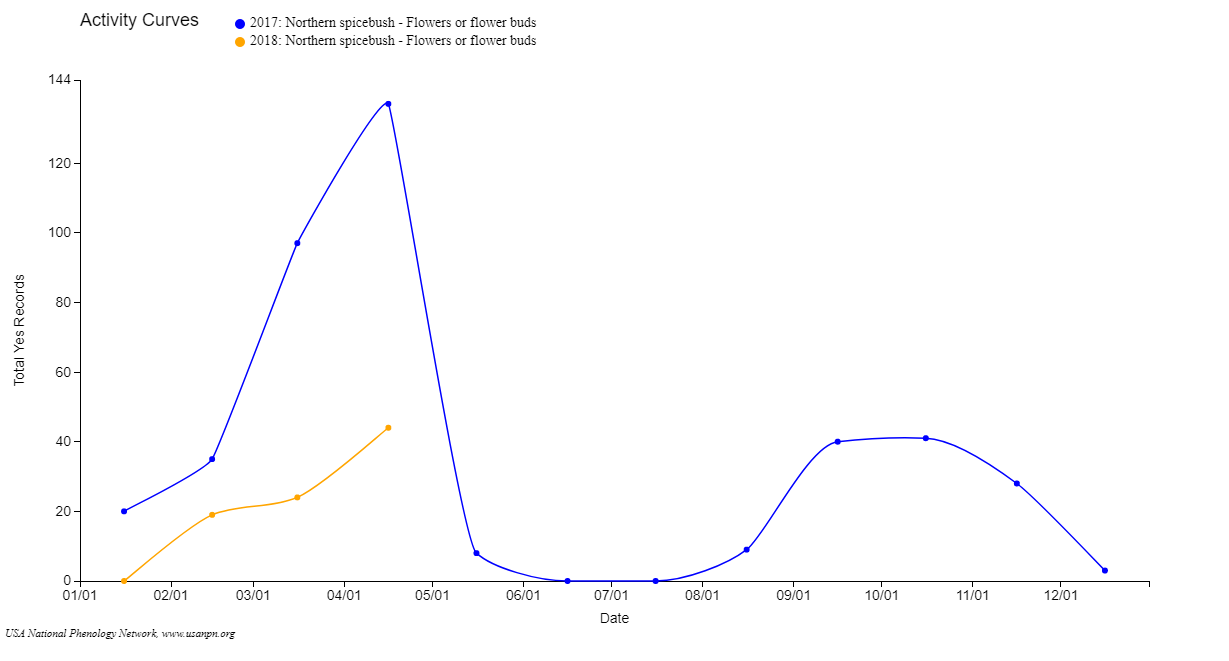
Figure 2: Northern Spice Bush activity curves for breaking leaf buds leaves and flower buds (By NPN)
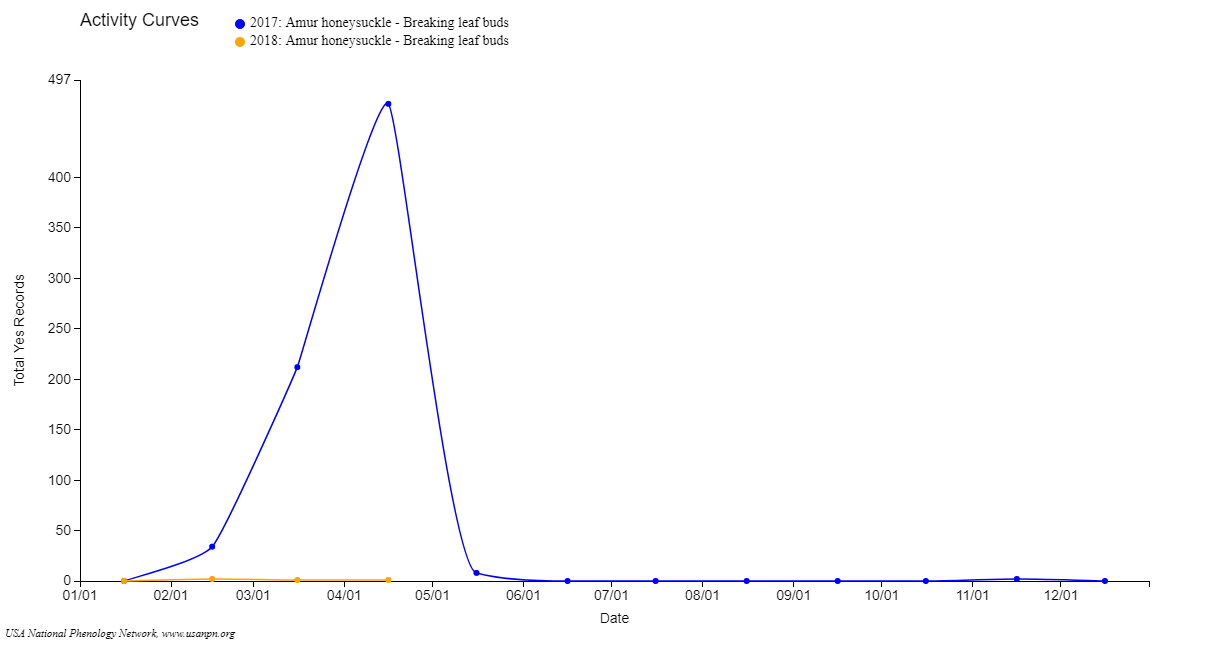
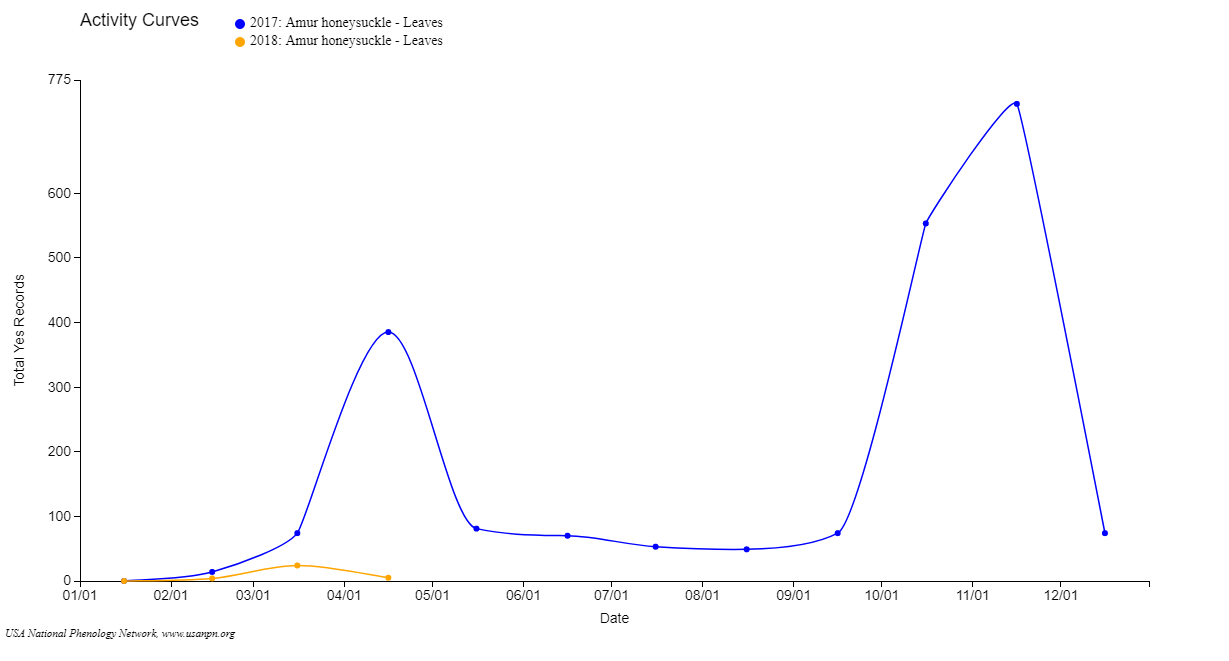
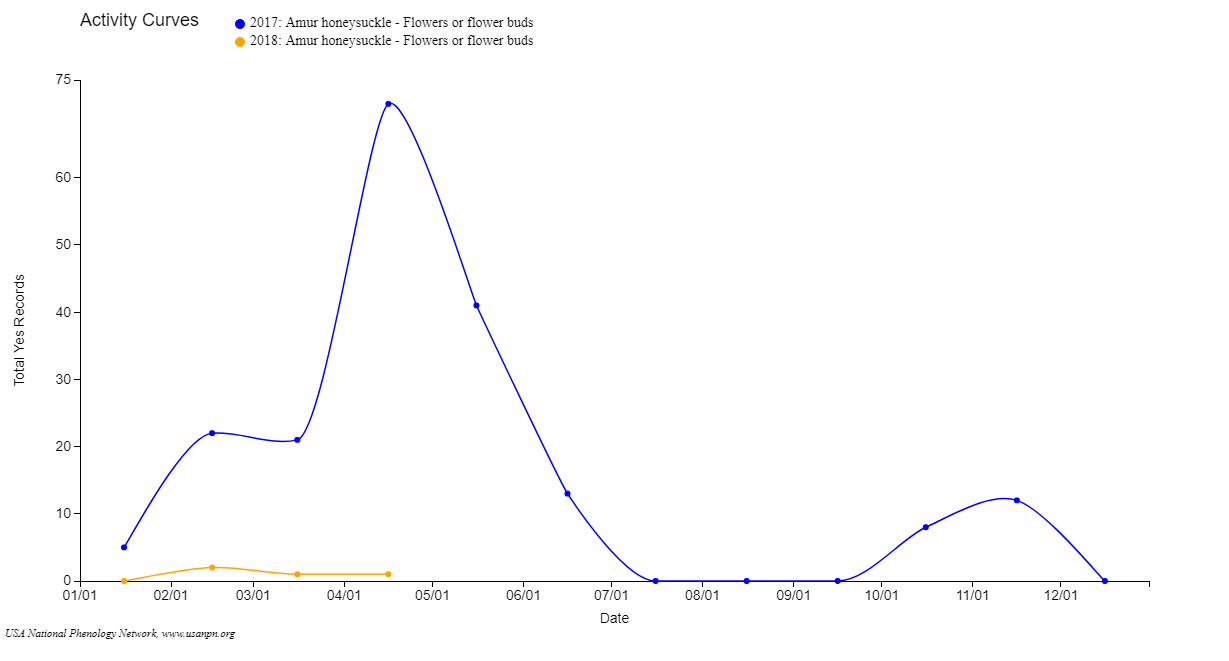
Figure 3: Amur Honeysuckle activity curves for breaking leaf buds, leaves and flower buds (By NPN)
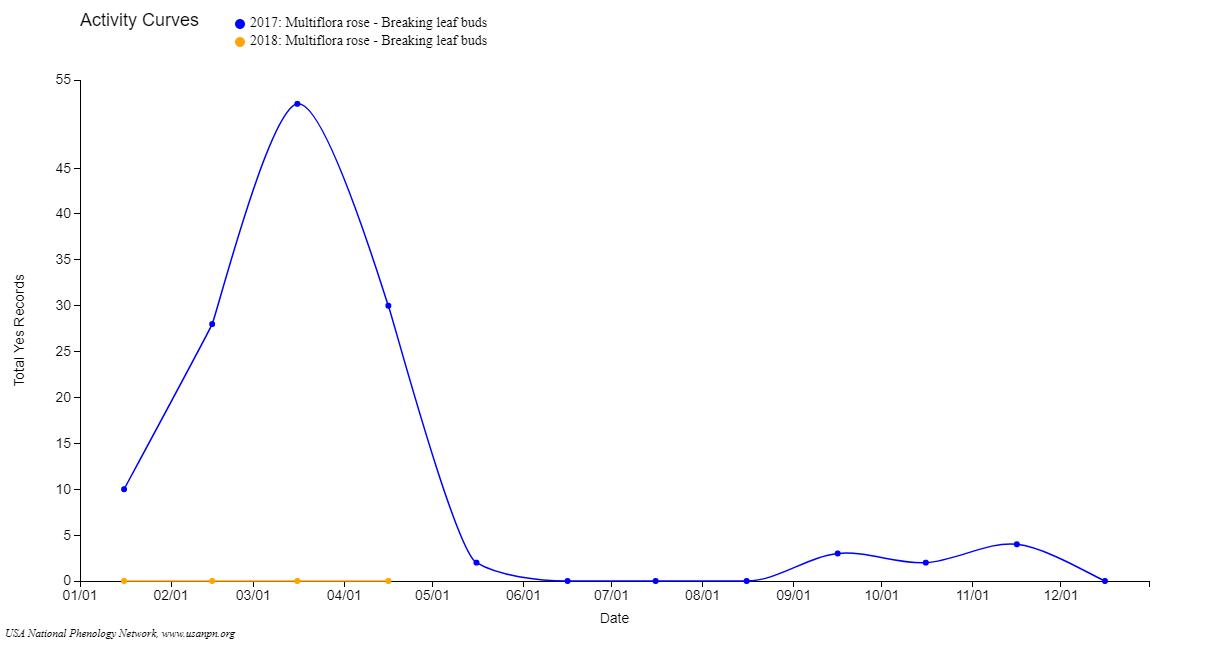
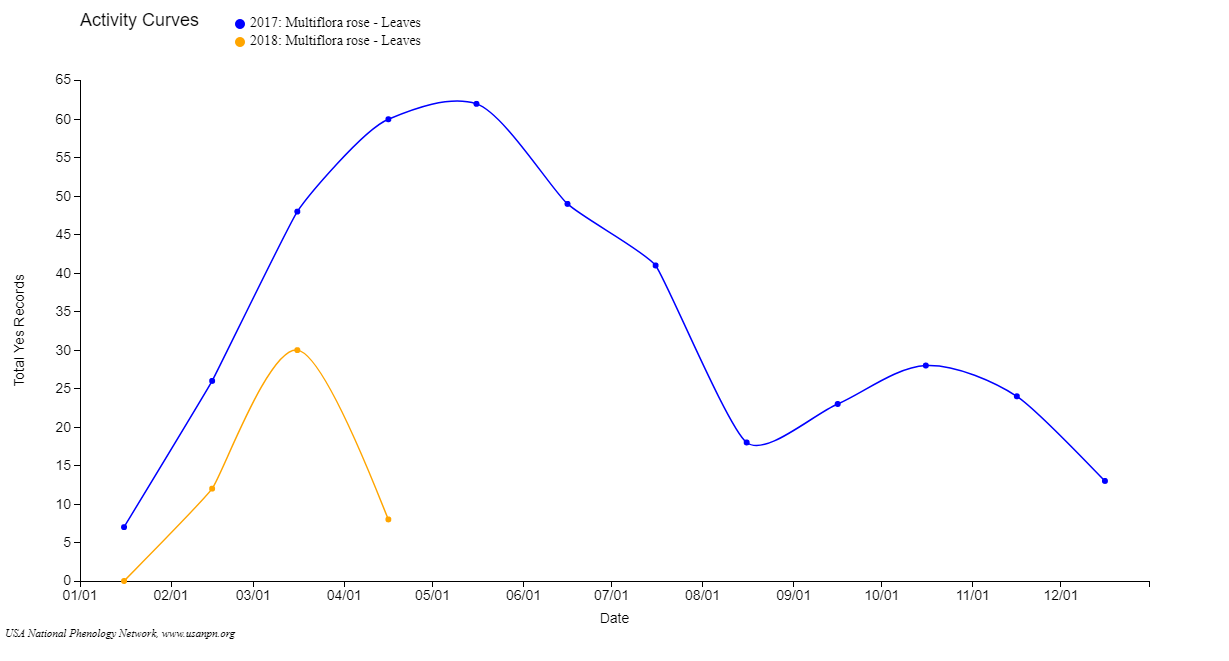
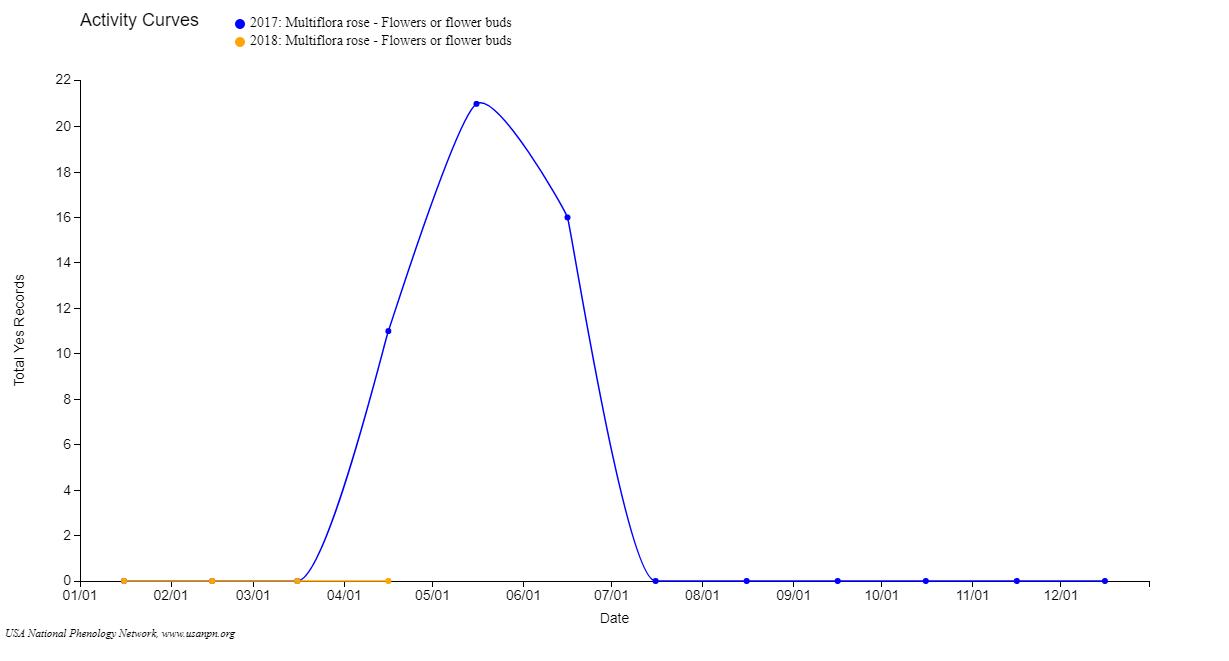
Figure 4: Multiflora Rose activity curves for breaking leaf buds, leaves and flower buds (By NPN)
Scatter Plot Summary
Our group created a scatter plot graphs between the 2017 and 2018 data of plants and observed the differences of native plant species and invasive plant species when discussing breaking leaf buds, leaves and flower buds. We placed a fit line to see if they were any positive or negative correlations between breaking leaf buds, leaves and flower buds from last year (2017) to this year (2018). Since this year (2018) is still in progress, our group will only focus from January 15th to April 15th of both last year (2017) and this year’s (2018) data.
The native plant species, such as Box Elder and Northern Spice Bush, have a negative correlation with the fit line test from last year (2017) to this year (2018). In all categories, breaking leaf buds, leaves and flower buds have decline drastically in 2018 compare to 2017, Figure 1. The invasive plant species, such as Amur Honeysuckle and Multiflora Rose, have mixed results from the fit line test from last year (2017) to this year (2018). For Amur Honeysuckle, breaking leaf buds and leaves have negative correlation from one year ago and is similar to both native plant species in the study. For Multiflora Rose, it had also received the same results with leaves being negative correlation as well, but breaking leaf buds was the only thing that had a positive correlation from the previous year (2017). As for flower buds, both invasive plant species did not have enough data for this year (2018) to compare last year’s (2017) data; therefore, no fit line test was need in the graphs, Figure 2.
The native plant species, such as Box Elder and Northern Spice Bush, have a negative correlation with the fit line test from last year (2017) to this year (2018). In all categories, breaking leaf buds, leaves and flower buds have decline drastically in 2018 compare to 2017, Figure 1. The invasive plant species, such as Amur Honeysuckle and Multiflora Rose, have mixed results from the fit line test from last year (2017) to this year (2018). For Amur Honeysuckle, breaking leaf buds and leaves have negative correlation from one year ago and is similar to both native plant species in the study. For Multiflora Rose, it had also received the same results with leaves being negative correlation as well, but breaking leaf buds was the only thing that had a positive correlation from the previous year (2017). As for flower buds, both invasive plant species did not have enough data for this year (2018) to compare last year’s (2017) data; therefore, no fit line test was need in the graphs, Figure 2.
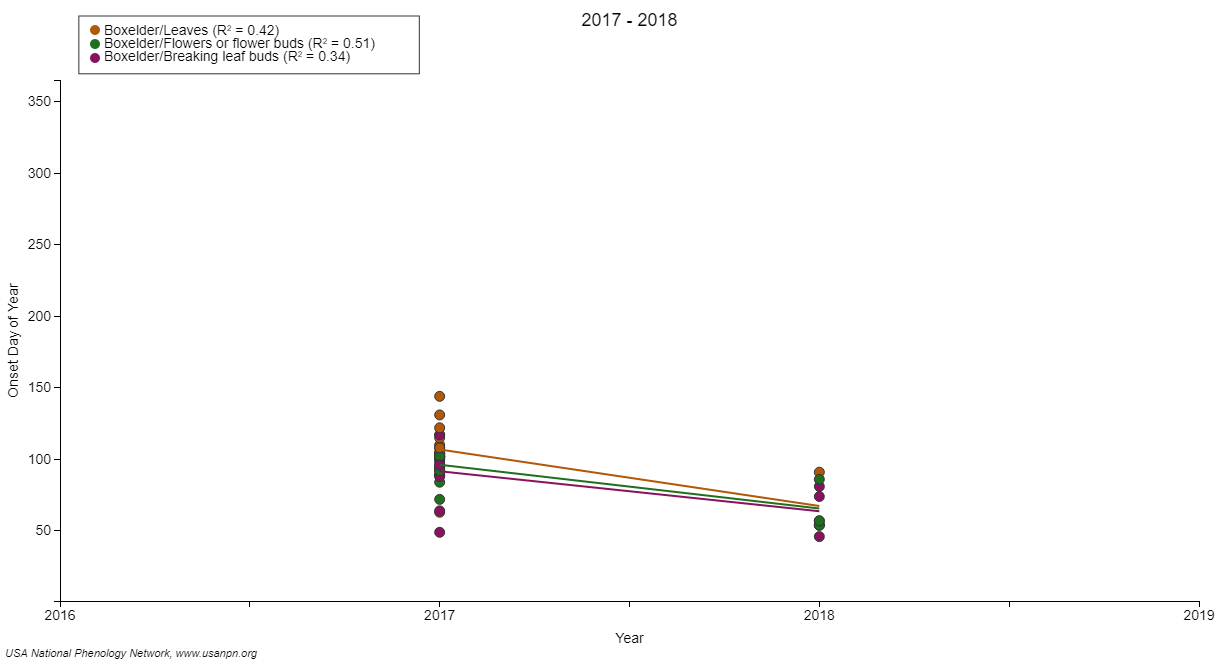
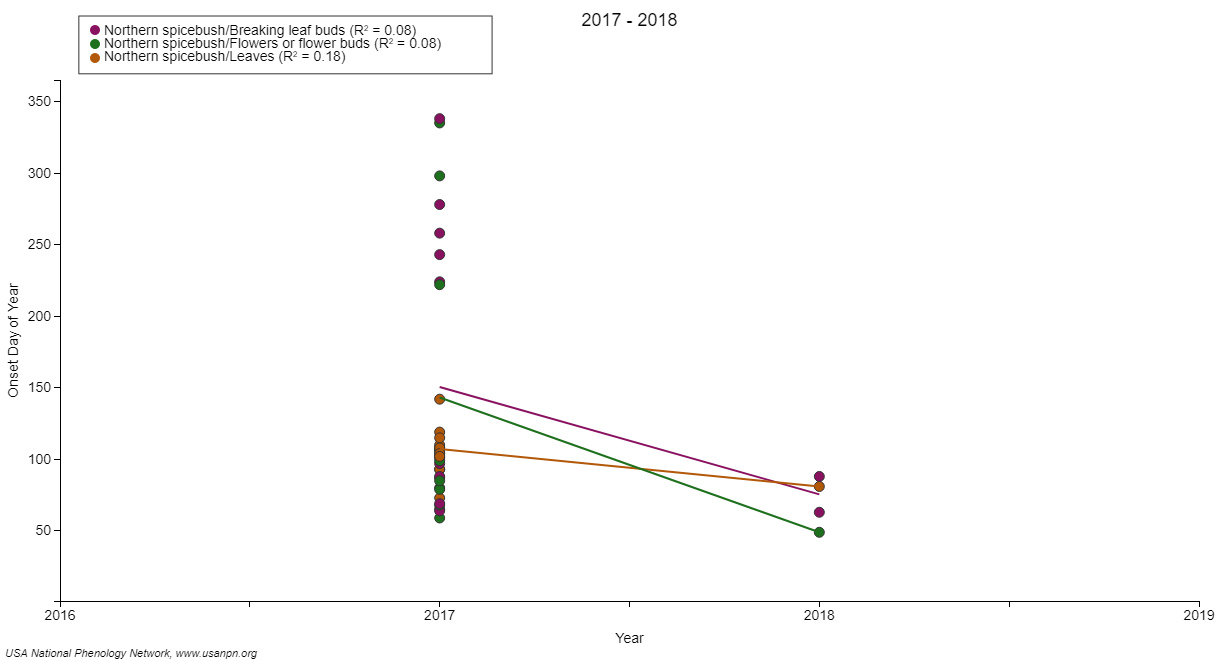
Figure 1: Native plant species, such as Box Elder and Northern Spicebush, scatter plot for breaking leaf buds, leaves and flower buds between 2017 and 2018 with a fit line (By NPN)
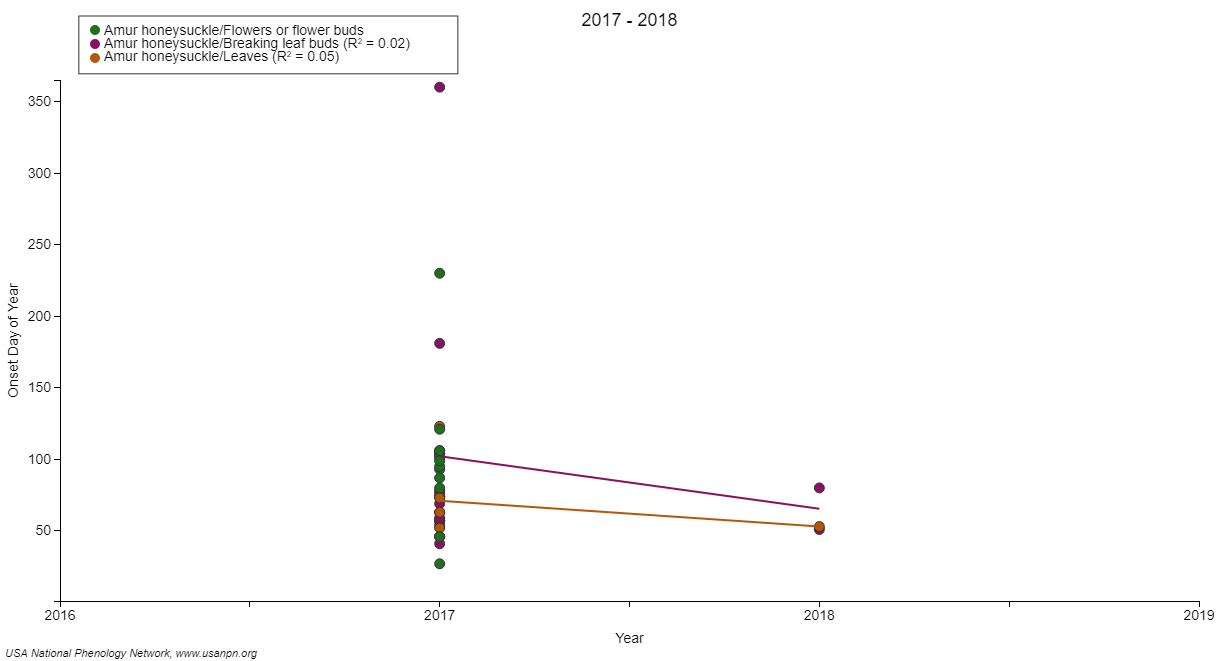
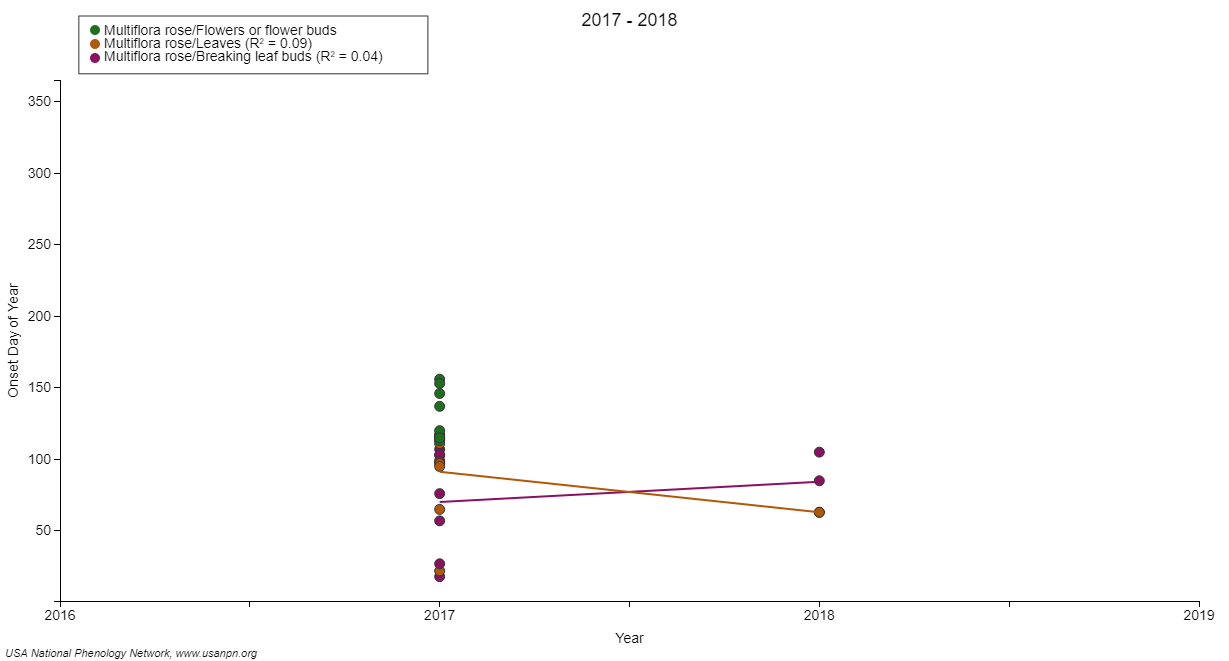
Figure 2: Invasive plant species, such as Amur Honeysuckle and Multiflora Rose, scatter plot for breaking leaf buds, leaves and flower buds between 2017 and 2018 with a fit line (By NPN)
References:
Nature’s Phenology Notebook (NPN). 2018. Green Wave. USA National Phenology Network. Retrieved from https://usanpn.org/nn/Greenwave
Nature’s Phenology Notebook (NPN). 2018. Shady Invaders. USA National Phenology Network. Retrieved from https://usanpn.org/nn/ShadyInvaders
Nature’s Phenology Notebook (NPN). 2018. Phenology: A National Indicator. USA National Phenology Network. Retrieved from https://usanpn.org/about/national-indicator
National Park Service. 2016. Inventory & Monitoring. Northeast Temperate Network (NETN). Retrieved from https://science.nature.nps.gov
Nature’s Phenology Notebook (NPN). 2018. Observation deck data sheet. USA National Phenology Network. Retrieved from mynpn.usanpn.org/npnapps/
Page created by: Devin Pitts, Gregory Steeves, Makayla Beckner, Zoe Krajcirovic
